Support and resistance indicator settings
How to tweak and optimize it.
If you haven’t watched the video I mentioned above, I highly recommend watching this video to understand how I would use the Support and Resistance indicator before we go any further into understanding how to tweak and adjust its settings.
There are a few settings that you should understand about this indicator to better help you use it effectively.
Multi-Time Frame Selector
The multi-time frame selector allows you to activate different support/resistance lines from other time frames to be viewed on your chart. In the picture below, you can see that even though I am on my H1 chart, I can activate the H4 support/resistance levels to see if there are any levels on the higher time frame I might have missed out on. This resulted in a big swing high I might have missed being shown.
SwingSensitivity :
This is how many bars you would need on the left/right of a high/low to create a swing high/low. This means that for example, if you have 20 as this value, then the swing high would require 20 bars to the left and to the right of it to be lower than it to create the swing high point. The higher this value, the stronger the swing highs/lows you identify.
InitialPips :
What the indicator does is it takes these swing highs/lows and plots a line to detect whether it coincides with other swing highs/lows. The InitialPips value is the ‘buffer’ it uses to detect whether another swing high/low is near it. A value of 5 would mean it scans 5 pips above and below the first swing high/low for any other swing high/low to reach it. The key idea here is to find areas where multiple swing high/lows coincide.
Recommended settings :
1 min chart : 1
5 min chart : 3
15 min chart : 5
30 min chart : 7
1 hr chart : 10
4 hr chart : 30
This is not a hard and fast rule, rather, the main idea is to provide more scanning area for overlaps as the time frame goes bigger.
FurtherPips :
Once the second swing high/low is reached, the indicator will use this new resistance/support area and do a modified scan based on FurtherPips. This works the same way as InitialPips.
Recommended settings :
1 min chart : 1
5 min chart : 3
15 min chart : 9
30 min chart : 15
1 hr chart : 25
4 hr chart : 50
This is not a hard and fast rule, rather, the main idea is to provide more scanning area for overlaps as the time frame goes bigger.
BrokenCount :
This value scans how many times the particular support/resistance identified has been broken. The more times a support/resistance level is broken, the weaker it is. A value of 0 means that the level can be broken only once. If it is broken a second time, it disappears.
BrokenBars :
This is the number of bars that must be closed below the support/resistance level for it to be considered truly broken (links with BrokenCount above). The reason for this is sometimes price tests these support/resistance levels and bounces back (like a doji). This actually means the support/resistance level is stronger and such a filter allows us to prevent such price action from tricking us.
I prefer to keep this at about 3 across all time frames.
ToggleStrength :
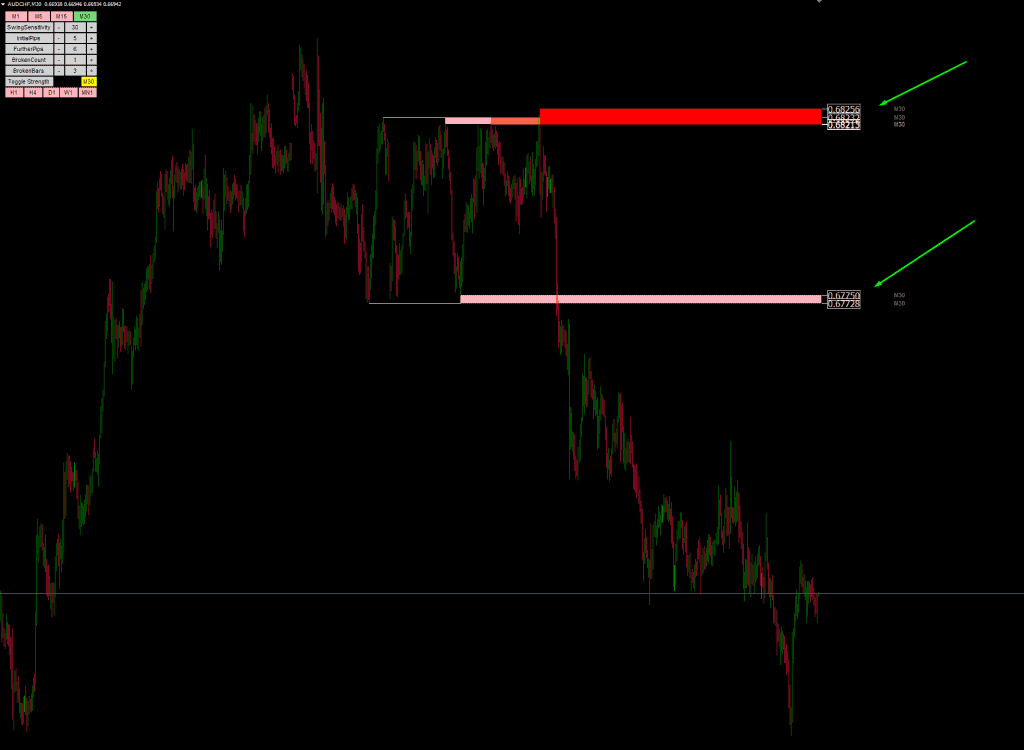
This toggles the thin lines with only one swing high/low and the thicker lines with at least 2 swing high/lows connected. This helps you pick out which are immediately the stronger levels to watch out for.
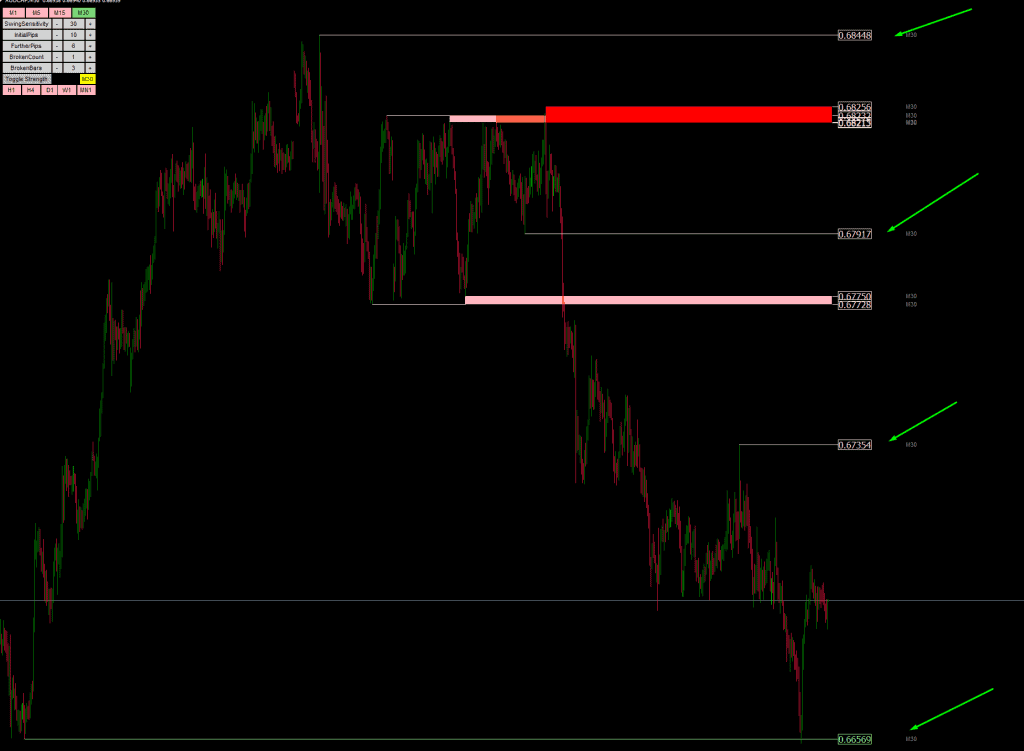
Here’s an image without the ToggleStrength. Notice how there are many more lines which have just 1 swing high/low on it. These are pointed out by the green arrows.
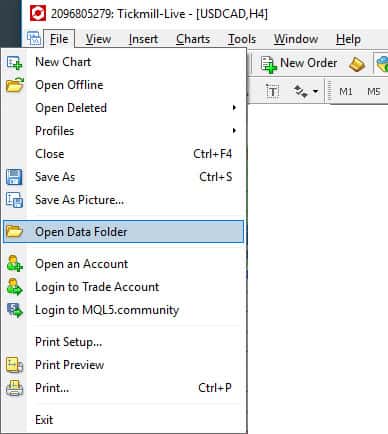
How do i Install this?
It’s as simple as 1, 2, 3!

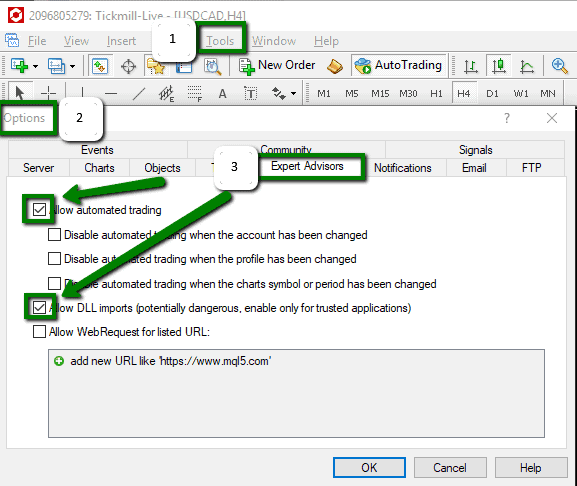
The next thing you have to do is to enable your MT4 to allow expert advisors. On the top of your MT4, there is a button called “AutoTrading”. Ensure that it is green and not red by clicking on it.
This won’t make the indicator trade for you – it’s there because there’s some licensing protection on this indicator.

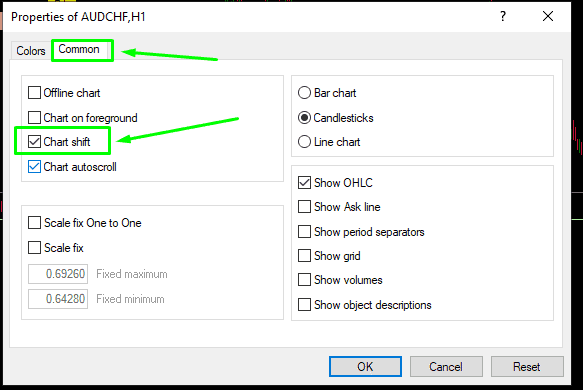
Once you’re done with all that, you have to enable “chart shift” so that the TFA support and resistance indicator has some space to operate and show you its levels.
To do that, press F8 > Common > ensure “chart shift” is checked as seen in the picture below.
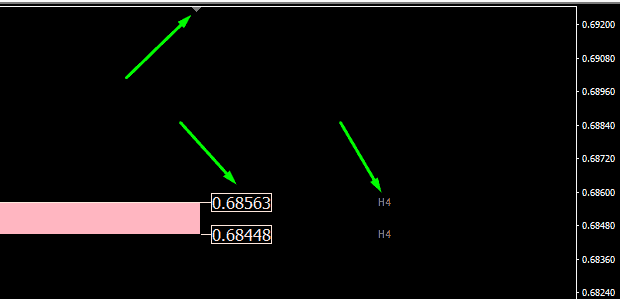
Once you enable “chart shift”, this nudges your chart to the left giving you some space on the right for the support and resistance indicator to show the levels and the time frame which the levels are coming from.
You can adjust how much space you want on the right by sliding the little arrow left/right as seen in the picture below.
Using Candlestick Patterns to improve your accuracy
Candle patterns (price action) tells you what is happening at the exact moment and is crucial for helping you determine whether the support or resistance level is going to hold.
The magic in price action (with Japanese candlesticks) is that it tells you exactly what is happening at the moment and from there, you can tell if the support or resistance level is going to hold.
I recommend you read our super in-depth article on our candlestick pattern indicator along with what goes into calculating the perfect bullish and bearish reversal patterns.
What this means is that sometimes, it looks like the support level is not going to hold (looks like it is going to get broken). Price might have reached it and broke through it – at this point, you would be forgiven to think that the support level you found is not working.
However, before the bar is completed, you notice that price forms a bullish hammer candlestick pattern. This is a very strong price action sign of a bullish bounce that could be happening,
So, what happens to your support level now? Previously, you thought it was going to be broken because of how price just broke past it. However, because of the recent price action formation, you instead have increased confidence that your support level is strong and you can play a bounce from here.
Using Fibonacci to improve your accuracy
Fibonacci retracements and extensions are the key
Firstly, you can greatly improve the accuracy and profitability of your support and resistance trading strategy by using Fibonacci.
You can use the leading element of Fibonacci Retracements and assess whether the support and resistance levels identified coincides with a key fibonacci retracement level. If it does, that increases its strength. The key levels to watch out for are 23.6%, 38.2%, 50%, 61.8%, 78.6%, 127% and 161.8%.
I highly recommend reading our guide on how to draw Fibonacci retracements correctly to better understand and utilize this magical tool.
Here’s an example of a key support level on AUDNZD lining up well with the 50% Fibonacci retracement level :
True RSI to improve your accuracy
Using the MT4 True RSI Indicator
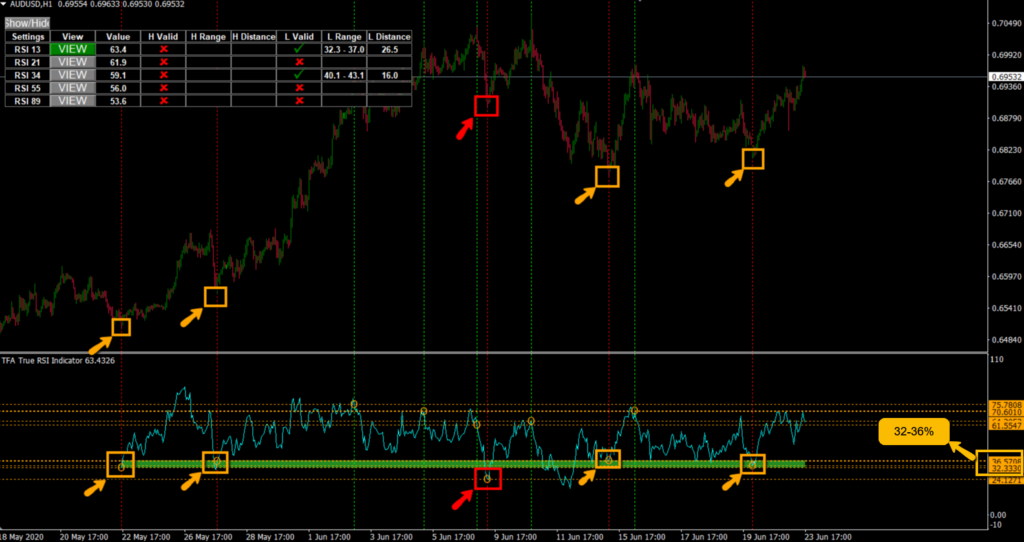
So another way to improve the strength of a support/resistance level is to add in the oscillator element by making use of the many effective ways to read the Relative Strength Index (RSI). We have an amazing RSI Trading Strategy that when combined with Support & Resistance, proves to be a truly profitably trading strategy.
Our proprietary MT4 True RSI Indicator achieves this really well by identifying the strong levels where price has historically bounced off. Here’s a picture of it in action:
True Stochastic to improve your accuracy
Using the MT4 True Stochastic Indicator
This method is learnt when I was advising the trading desks of the largest banks and institutions. Really interesting and effective!
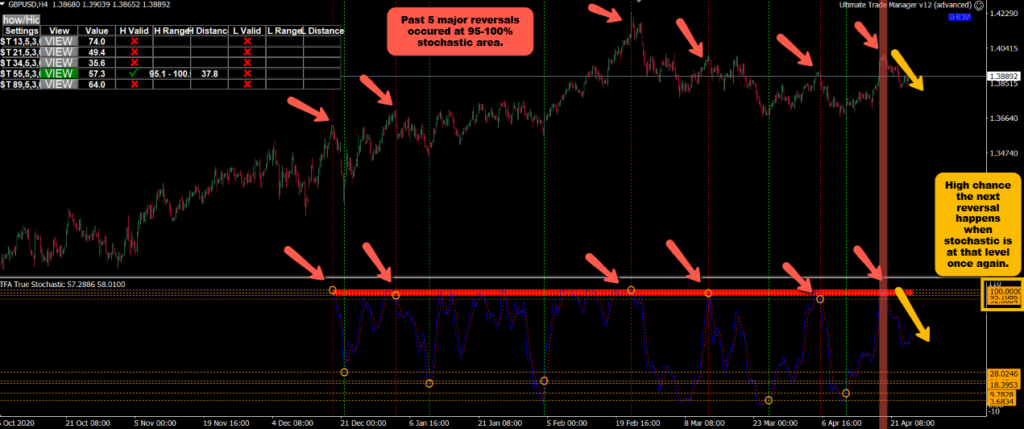
You are able to greatly improve your accuracy when trading with Support and Resistance by combining it together with our proprietary MT4 True Stochastic Indicator.
The trick is to find the hidden/true stochastic support level and see how it tallies with the support level you found (vice versa for resistance). Below is an example of how this looks like and how it worked out perfectly.

