RSI TRADING STRATEGY
How we use RSI in the big hedge funds.
There’s the correct way to use RSI to trade and the way the world teaches you. Most forums, gurus and sites teach you that the overbought and oversold levels are 70 and 30 respectively. When price reaches these levels, you should expect a bounce. Correct? – WRONG!
That is simply what the world teaches you so they know where the bulk of volume for buys and sells are coming in. Who has ever said that the magical number 70 is the oversold level and 30 is the overbought level, right?
How do you know of this secret RSi trading strategy?
And why should we trust you?
So my team runs EFG – an award-winning research house (The Technical Analyst 2019 & 2020 for Best FX Research & Best Equity Research to be specific) – and we have advised the trading desks of the largest banks, hedge funds and asset management companies and I can assure you that there’s a different way to look at RSI that can really improve your profitability.
Now, this could be used as a trading strategy by itself but is best when combined with other strategies (particularly Fibonacci and Support & Resistance).
What makes this RSI Trading Strategy better than the rest?
You know, the 70/30 and 80/20 ones.
Well, I trade for a living. I learnt my technical analysis from the best and my team currently provides technical analysis to some of the largest brokers including Tickmill, AxiTrader, XM and VantageFX. There are many ‘educators’ out there who don’t walk the talk. Here’s a recent video created by DollarsandSense in collaboration with IG showing the day in my life trading.
Anyway, I just wanted everyone to know that you should not trust people just because they tell you to or they have 1,000+ posts to their name in some random forex forum. Do your due diligence, this is your money on the line! Anyway, enough about me and let’s dive into how this strategy works.
How does this RSI trading strategy work?
What’s the secret sauce?
So the trick is in finding a True RSI level that price bounces off. Instead of 70, this could be 60. Instead of 30, this could be 40. That is the True RSI of the market. How does this look like? Here’s a screenshot of how our special True RSI Indicator works in finding out key levels where price bounces off.

As you can see in the image, the TFA True RSI indicator has scanned for 5 major swing lows that bounced really nicely (we can adjust the sensitivity and how strict these big swing lows are). So in the past 5 times price bounced nicely – it coincided with RSI being at 32-36% 4 out of 5 times (4 orange boxes show how nicely it bounced, 1 red box to show that it didn’t bounce).
So what does this tell us? It means that there’s an 80% chance approximately that when RSI reaches the 32-36% level, there will be a bounce in price. With this strategy by itself, we already have an edge over the market to trade and make money (really? yes!). But if you wish to really increase your trading profitability, you can add in basic support and resistance and even Fibonacci to this.
Why 4 out of 5? Why not 8 out of 10 ties?
Yes, this is possible in the TFA True RSI Indicator settings. We are able to adjust the confidence level (eg. 80% bounce success) and minimum counts required (eg. 10 bounces as the sample size instead of 5).
However, I personally find that 8 out of 10 times might be a bit too hard to attain. You’ll find less setups but you’ll also find better setups when they do appear. My sweet spot currently is 4 out of 5 times.
How do i get this indicator?
Free version scans for RSI 21
Is there a particular RSI indicator value you use?
Like 14 period or something?
Over years of testing, we narrowed down the most successful RSI periods to these 5 values:
- 13
- 21
- 34
- 55
- 89
What we have done is to allow up to 5 RSI values to be tested at once in the indicator. This will allow the TFA True RSI Indicator to scan for bounces across multiple RSI period values and the table will show you if there are hidden True RSI levels on the chart.

As you can see in the above picture, we are scanning across 5 RSI settings (13,21,34,55,89) and our True RSI indicator will show us which area has valid hidden RSI area levels.
Here’s an explanation of the various settings:
- Settings:
This is the various RSI settings we are testing (up to 5 at a time) - View:
Clicking on this will load the RSI along with the hidden area. We usually click “View” only if there is a valid hidden RSI area. - H valid:
High valid meaning there is a hidden RSI Swing High resistance area (when we’re playing drops instead of bounces). - H Range:
Shows the hidden RSI area range for this hidden RSI swing high resistance. - H Distance:
Shows the distance of the current RSI to the hidden area. The lower the number means the closer it is. - L valid:
Low valid meaning there is a hidden RSI Swing Low support area (where we play bounces from). - L Range:
Shows the hidden RSI area range where the hidden RSI swing low support is. - L Distance:
Shows the distance of the current RSI to the hidden area. The lower the number means the closer it is.
“You mean this works for finding overbought areas too?”
> Yes, that’s right. Let me show you how it looks like:

As you can see in this photo. We used the same 80% confidence criteria with a sample size of 5 and found out that there’s a hidden RSI resistance area from 58-61% (very different from the 70% most people tell you!). The orange arrows + boxes show where the valid reversals occur. The red arrow + box shows the 1/5 time it didn’t reverse properly. So since there are 4 orange (valid) and 1 red (invalid), that still gives us an 80% confidence criteria.
With this approach, you can greatly improve any trading strategy you have by identifying high probability reversal levels.
So what else do I need to know about this indicator?
Well, it is flexible meaning you can adjust the sensitivity of many things. Here’s a screenshot of the settings along with its explanations.
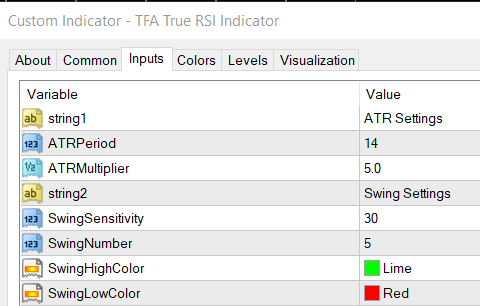
So here’s an explanation of the settings:
- ATR Period, ATR Multiplier, Swing Sensitivity
These 3 go hand-in-hand to define how large your swing low and swing highs are on the price chart. We need these because we want to create nice beautiful swing lows and swing highs.
Here’s an example of how this works:
ATR Period = 14 (assuming current ATR value is 10 pips)
ATR Multipler = 5 (so 10 x 5 = 50 pips)
Swing Sensitivity = 30 bars
This means that you’ll need a swing high/low of at least 50 pips within 30 bars to be considered a valid swing high/low for the indicator.

- Swing Number:
This is the number of swing highs/lows you will consider. We don’t want too many as it can get quite messy. I usually stick to 5 as the sweet spot. That means we’ll look for the past 5 major swing highs and past 5 major swing lows.
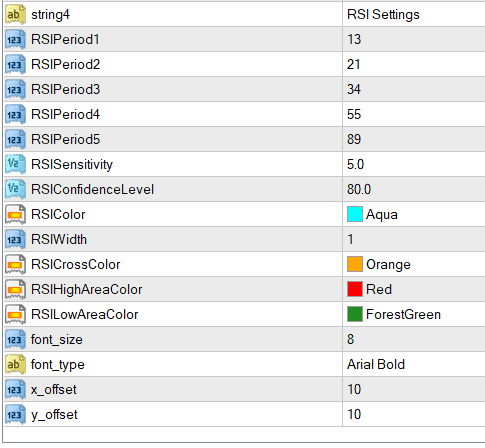
- RSI Period (1,2,3,4,5):
These are basically the RSI period settings you wish to test. I personally find the 13, 21, 34, 55, 89 numbers the best. - RSI Sensitivity:
This measures the sensitivity of the “hidden area”. If you have a sensitivity of 5, that means it scans within a 5% area (eg. 10% to 15%). The smaller this number, the more accurate the area has to be. I don’t recommend it being too small though, 5% seems to be the sweet spot. 10% will find large areas and that would not be as useful. - RSI Confidence Level:
Remember “SwingNumber” I mentioned above? This is basically the percentage of swing highs/lows that need to fall within our hidden area (as defined by RSI Sensitivity) above. So, if our swing number is 5 and our RSI Confidence Level is 80%, that means that 80% of the most recent 5 swing highs/lows need to coincide exactly within a 5% area (assuming our RSI Sensitivity is 5%). So this means 4 out of 5 most recent swing high/lows is the minimum requirement.
If you like, you can put this at 100% and require all 5 to line up perfectly but that’s quite a strict criteria. - The rest are just colour settings to play around with 🙂
How do i get this indicator?
Free version scans for RSI 21