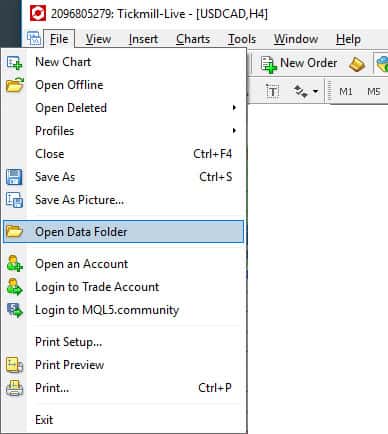
How do i Install this?
It’s as simple as 1,2,3!
When you download the installation file, there will be 2 files inside the folder. They are:
1. TFA Candlestick Pattern Indicator.ex4
(goes into MQL4 > Indicators)
2. patterns.csv
(goes into MQL4 > Files)
For detailed instructions on how to do this, refer to the additional steps below.

Now, you have to place “patterns.csv” into the correct folder. This folder is located at MQL4 > Files. Just paste it in there.
Important: Do not rename patterns.csv into any other name. Otherwise, the indicator will not be able to find it.

The last thing you have to do is to enable your MT4 to allow expert advisors. On the top of your MT4, there is a button called “AutoTrading”. Ensure that it is green and not red by clicking on it.
This won’t make the indicator trade for you – it’s there because there’s some licensing protection on this indicator.

Using Support & Resistance to improve your accuracy
Support & Resistance when combined with candlestick patterns is a truly potent trading tool to have in your arsenal.
One of the best ways to improve the accuracy of your reversals when you are using candlestick patterns is to add in proper support and resistance levels.
We have written an entire article on how to determine these levels along with an indicator we built to help identify this. You can check it out on our support and resistance indicator page.
Using Fibonacci to improve your accuracy
Fibonacci retracements and extensions are the key
Next, you can greatly improve any trading strategy if you learn to combine it with Fibonacci retracements.
I wrote what is probably the most comprehensive tutorial on how to use Fibonacci Retracements and you really should take a look at it here: How to properly draw Fibonacci Retracements. You can use its leading element and assess whether the support and resistance levels, or candlestick patterns identified coincides with a key Fibonacci retracement level. If it does, that increases its strength. The key levels to watch out for are -23.6%, -61.8%, 23.6%, 38.2%, 50%, 61.8%, 78.6%, 127% and 161.8%.
I highly recommend reading our guide on how to draw Fibonacci retracements correctly to better understand and utilize this magical tool.
Here’s an example of a key support level on AUDNZD lining up well with the 50% Fibonacci retracement level :
True RSI to improve your accuracy
Using the MT4 True RSI Indicator
So another way to improve the strength of your trading strategy is to add in the oscillator element by making use of the many effective ways to read the Relative Strength Index (RSI). We have an amazing RSI Trading Strategy that when combined with your trading strategy increases the probability of successful trades.
Our proprietary MT4 True RSI Indicator achieves this really well by identifying the strong levels where price has historically bounced off. Here’s a picture of it in action:
True Stochastic to improve your accuracy
Using the MT4 True Stochastic Indicator
This method is learnt when I was advising the trading desks of the largest banks and institutions. Really interesting and effective!
You are able to greatly improve your accuracy when trading with Support and Resistance by combining it together with our proprietary MT4 True Stochastic Indicator.
The trick is to find the hidden/true stochastic support level and see how it tallies with the support level you found (vice versa for resistance). Below is an example of how this looks like and how it worked out perfectly.


