At EFG we believe in two things. Firstly, financial markets are fractal in nature and that Chaos theory can be applied to the markets. What may seem like random price movements and patterns can actually be determined by using a systematic multi-timeframe approach along side cross-assets correlation.
The Fractal nature of markets stem from the Fractal Markets Hypothesis which takes into account investor behaviors that influences price. On a day-to-day basis, investors make financial decisions in the markets. Over a period of time, these decisions are repeated over again, over a much longer timeframe and thus allow us to notice a cyclical pattern.
Similarly, under Chaos Theory, the financial system that is seemingly unpredictable in the long term, can actually come from a very deterministic system on the shorter timeframe. Like how the butterfly effect actually describes that the beat of a butterfly’s wings in the Amazon could influence the weather in China.
By putting these two together and applying multi-timeframe analysis, we are able to identify key price inflexion levels where our clients can best position themselves.
Chart Presentation is based on 3 factors:
Graphical levels
Single swing high/lows
Multiple swing high/lows
Pullback support/resistance
Overlap support/resistance
Trend lines (At least 2 touches)
Channels (At least 3 touches)
Chart Patterns
Fibonacci levels
Fibonacci Retracements
Fibonacci Expansions
Fibonacci Extensions
Fibonacci Projections
Indicator levels
Natural Moving Averages
RSI/ Stochastic
Ichimoku cloud
MACD
The EFG Approach
☐ Are there horizontal levels? (pullbacks, overlaps, significant swing highs/lows)
☐ Are there trend lines? (using significant swings)
☐ Any channels? (min 4 touches – 2 at top, 2 at bottom)
☐ Any other chart patterns? (wedges, triangles, double top/bottom)
☐ Any death / golden cross? (200/50 SMA)
☐ Any natural moving average that catches nice price movements? (look for at least clear 3 bounces/reactions)
☐ Stochastic/RSI – Check recent 3 bounces/reactions. Did they line up nicely at a certain stochastic/RSI level (within 5% of each other).
☐ Stochastic/RSI any clear bullish or bearish divergence? (check for long term and short term)
☐ Correlation – any strongly correlated currency pairs that are supporting your bias?
☐ Correlation – any strongly correlated asset class supporting or against your bias? (eg. USDCAD and Oil)
☐ Correlation – for crosses, what does the majors say? Eg. AUD/NZD should check AUD/USD and NZD/USD
☐ For reversals – any Fibonacci confluence (retracement, extension, expansion, projection) to support the reversal?
☐ For reversals – has shorter term price broke the 23% retracement? (good trigger for price to drop further)
☐ For breakout – did price break a recent Fibonacci confluence area?
☐ For breakout – any chance to get in on the pullback (discount)?
Analysis Presentation
Starting Points
When picking the starting point of pivot (entry), support, resistance levels, these are the rules:
Check if there’s a swing high/low, pullback or overlap level to start from.
Go as far back as possible.
Intersecting the wicks is preferred (refer to image for example)
Fibonacci Explanations
Fibonacci Rule: Trend line MUST Follow Price Structure Closely
(Multiple pictures)
Whether you are drawing Fibonacci retracements, projections, extensions or expansions, there is one important rule:
– Your Fibonacci trend line MUST follow price structure clearly. – Trend line can deviate from price structure, but not by too much.
In the example on the right – you can see two examples. One follows price closely while the other cuts through price structure.
The trendline can deviate from price structure by a bit, but most of it should follow price structure.
Wrong way of drawing Fibonacci - the trend line cuts through price structure and the deviation is too much.
Correct way of drawing Fibonacci - even through the second fibonacci retracement cuts through market structure, it didn't deviate by too much.
Fibonacci Retracement
Tool used: Fibonacci retracement
Fibonacci Retracement percentage used:
-61.8% (Fibonacci expansion)
-27.2% (Fibonacci expansion) ——————————————–
23.6%
38.2%
50%
61.8%
78.6% ——————————————–
127.2% (Fibonacci extension)
161.8% (Fibonacci extension)
Explanation: Although the tool used is Fibonacci retracement, it can lead to 3 types of Fibonacci. Expansions (those below 0%). Retracements (those from 0-100%) and extensions (those above 100%).
Fibonacci retracements have a (1) starting and (2) ending point as seen in this gif.
Fibonacci Projection
Tool used: Fibonacci projection
Fibonacci projection (which uses 3 points) should not be confused with Fibonacci retracement (which uses 2 points).
Fibonacci projection percentage used:
61.8%
78.6%
100%
127.2% (weak, only use as supporting argument)
161.8% (more often used in Elliott Wave)
200% (only use if looks like wave 3 over-extension)
Pro tip: You are usually looking for a “Flash” zigzag in these type of Fibonacci projections.
Explanation: For Fibonacci projections, you are taking the vertical distance from (1) to (2) and projection it from (3) onwards.
Fibonacci projection has 3 points. (1) Starting, (2) Middle and (3) Ending
Fibonacci Expansion
Tool used: Fibonacci retracement
Fibonacci Retracement percentage used:
-61.8% (Fibonacci expansion)
-27.2% (Fibonacci expansion)
Pro tip: Look for a “Flash” zigzag when identifying these fibonacci expansions.
Explanation: The clearer the movement of the “Flash” zigzag, the better. We ideally need to wait for prices to retrace at least 50% in point (3) before taking off in the other direction (also preferably in a straight line movement).
Fibonacci expansion uses the Fibonacci retracement tool. It starts at (1) and ends at (2). Price needs to minimally retrace at least 50% as seen in point (3) before it can continue its move up.
Fibonacci Extension
Tool used: Fibonacci retracement
Fibonacci Retracement percentage used:
127.2%
161.8%
Pro tip: Look for a “Nike” tick to find these very powerful setups.
Explanation: Price usually retraces the entire move from (1) to (2) – hence the reason the retracement is >100%. The clearer the movement of the “Nike” tick, the better.
Fibonacci extensions require you to look for a "Nike" tick - retracing more than the entire move from point (1) and (2) and going beyond it.
Fibonacci Confluence
Explanation: Fibonacci confluence is when you line up multiple fibonacci levels together to come up with a strong area where they are quite close to each other.
From there, you play a contrarian trade (reversal) by either playing a bounce of a reversal.
Combination of Fibonacci retracement, fibonacci extension, Fibonacci expansion and Fibonacci projection all lining up at one strong area where we see price bounce from.
Significant Swings (Correct)
This forms the basis of all starting, middle and ending points when using Fibonacci.
You shouldn’t pick swing highs and lows that are not significant. Meaning, they need to have a relatively big move before/after it.
As a rule of thumb, use at least 15 bars before/after for these significant swings.
Finding significant swings to use for Fibonacci retracements and projections
Insignificant Swings (Wrong)
These are insignificant swings and should not be used when drawing all forms of Fibonacci. They are too small and won’t be effective.
These swing highs and lows are too insignificant. Don't fall into the trap of using these small up/down moves to draw your Fibonacci points.
Graphical Elements Explanation
Single Swing High/Low Resistance (weak)
Using a recent swing high/low is a weak level if it the only level.
You can use it as a take profit target or stop loss level. But you should not use it as an entry if there is no other supporting arguments (such as Fibonacci or other graphical levels).
Recent swing high and swing low resistance don't tend to be very strong levels. But from a graphical presentation perspective, they can be used.
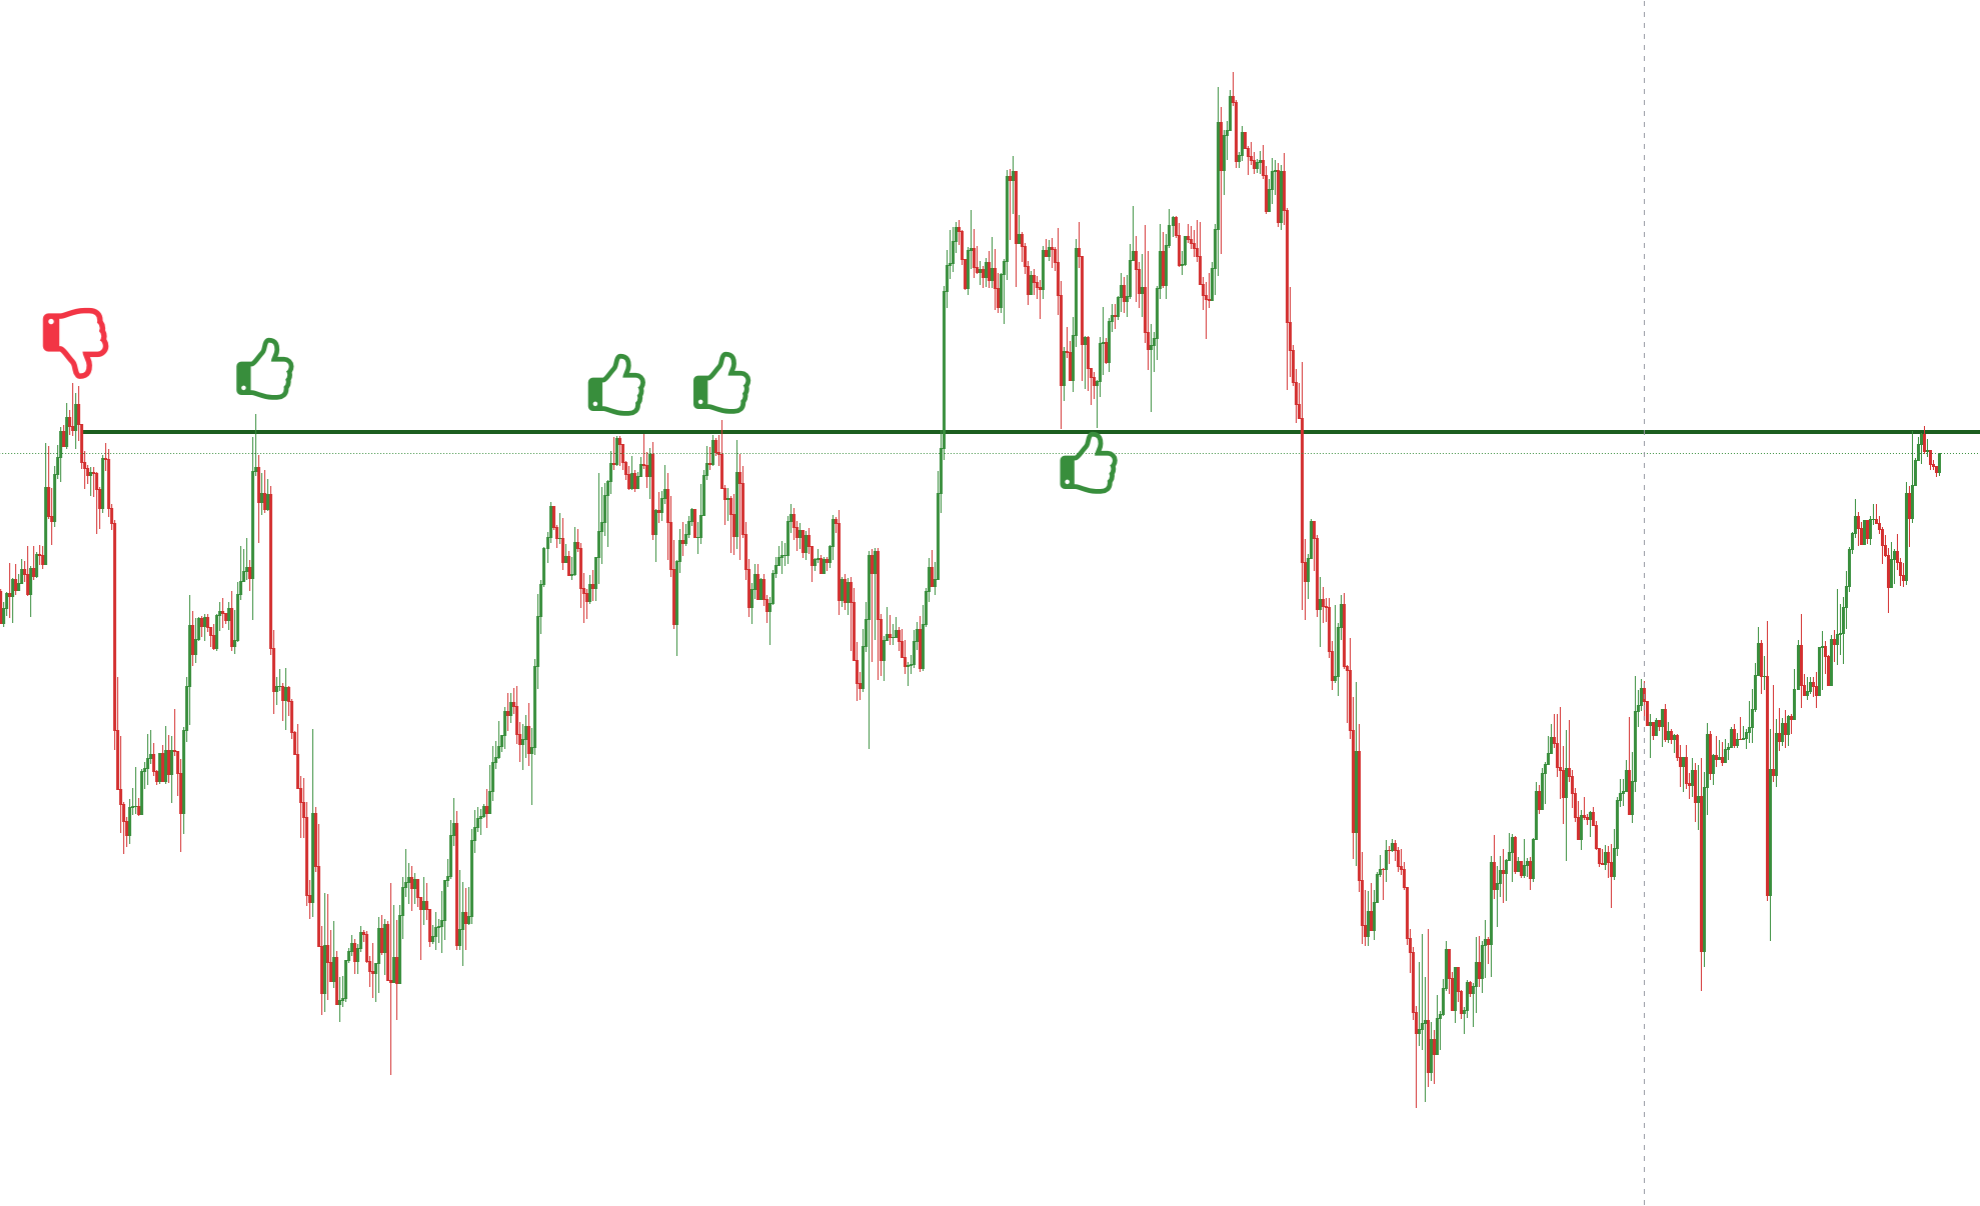
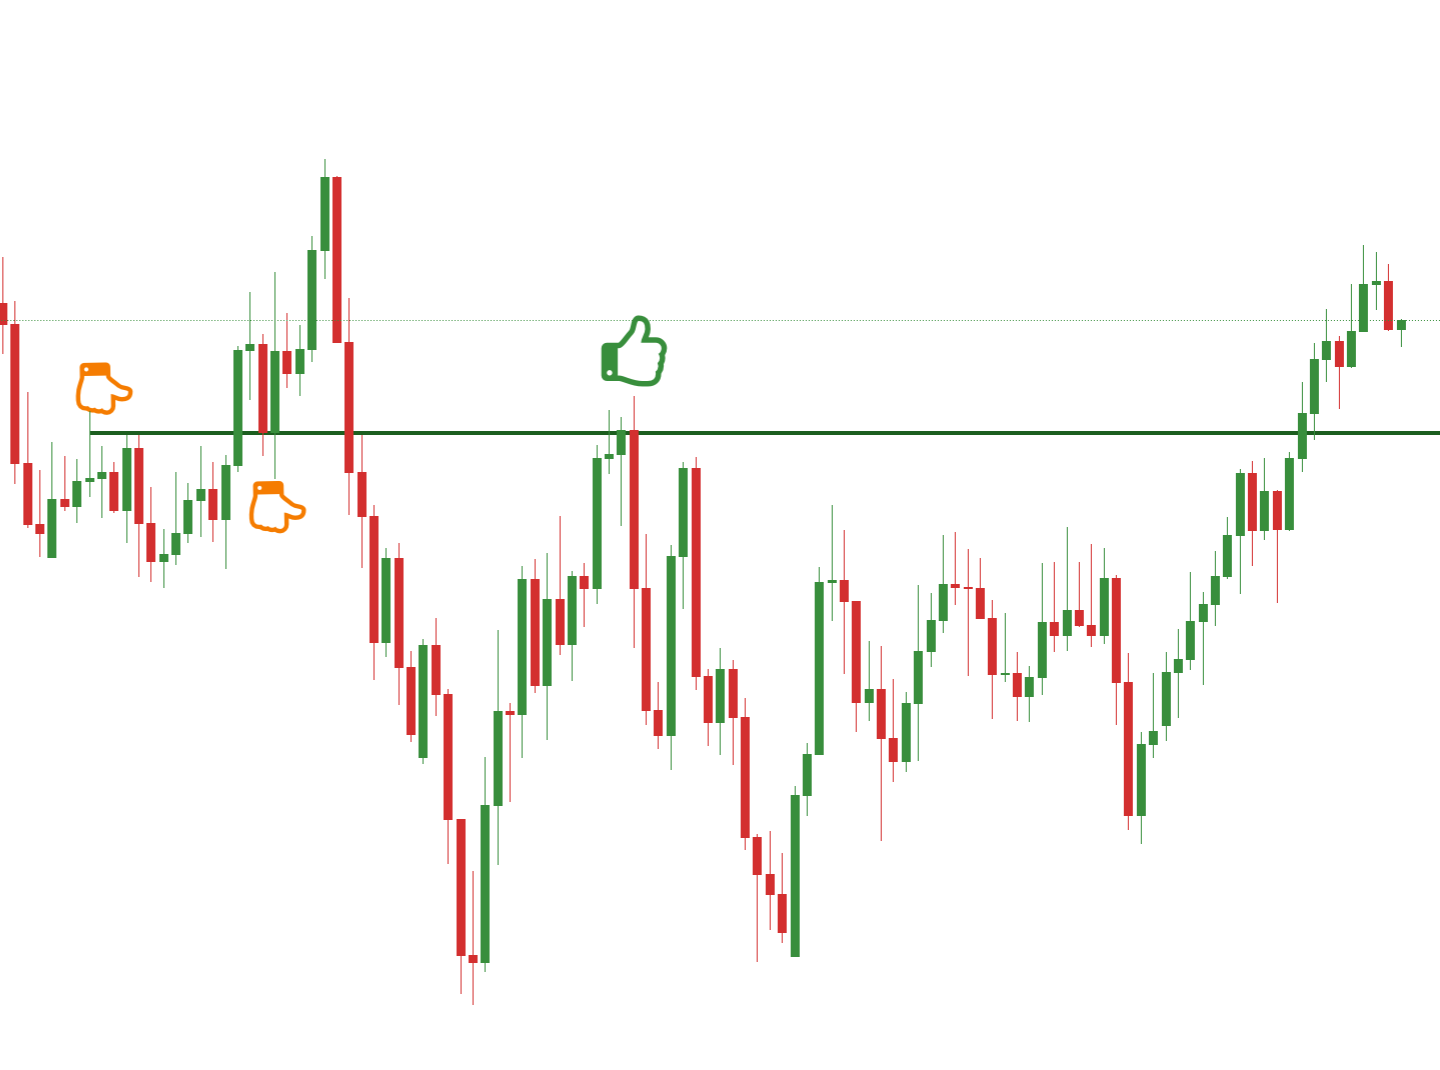
Multiple Swing High/Low Resistance (strong)
If at least 2x swing high/low levels line up nicely, it is a much better level to use.
Try to find areas where these might line up. It does not need to be the exact level – as long as it’s an area that is near enough.
The trick is to slowly see how far back your resistance/support line can go while still cutting mainly the wicks of the previous swing highs/lows. From there, you then form an area to reference to.
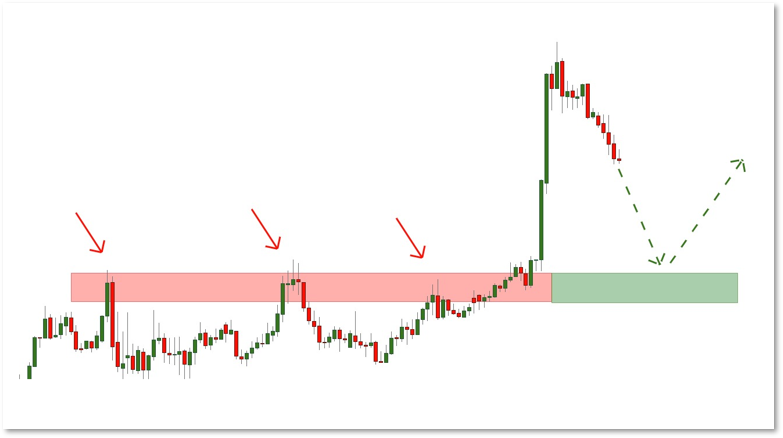
Pullback Support/Resistance
(multiple pictures)
A pullback Support is a strong level of support. It breaks out from a previous resistance level and price is now dropping back to visit it again.
Pro tip: When a pullback Support lines up with a Fibonacci level, it is very powerful.
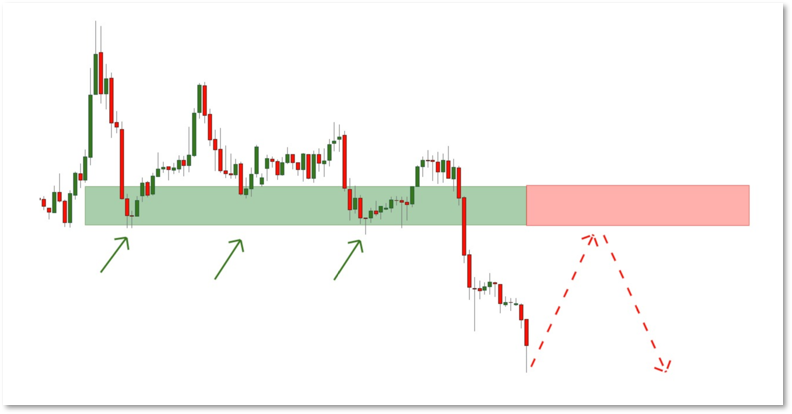
Pullback resistance works well when it breaks a significant swing low and then starts pulling back to it. Even better when there are multiple fibonacci levels lining up nicely at that level.
Pullback support example
Pullback resistance example
Overlap Support/Resistance
An overlap support is when there are prices touching the line from the top and bottom.
This means that there are bulls and bears respecting that area so it’s an important point to take note of.
Pro tip:
If the overlap area lines up with other elements such as Fibonacci or graphical elements, it would make it even stronger.
Overlap resistance - when price reacts off a particular level from the top and from the bottom. The more times it reacts off this area, the stronger the overlap area.
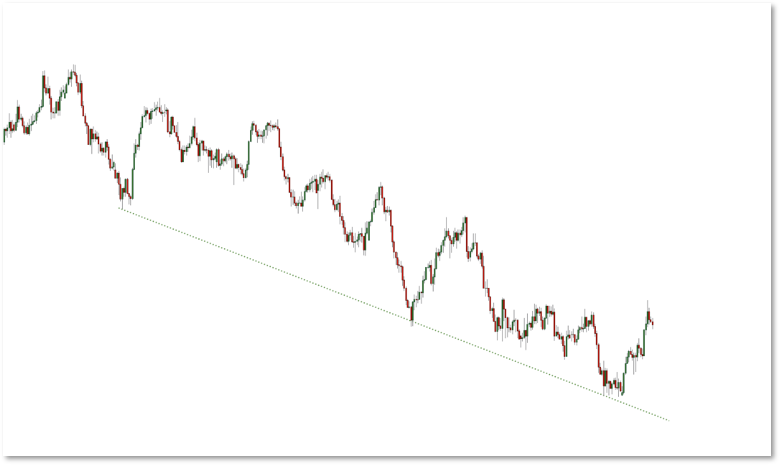
Trendlines : Wrong Way
Descending trend lines should be from the TOP. Not the bottom.
Ascending trend lines should be from the BOTTOM. Not the top.
In this example, we can see that the descending trend line is drawn from the bottom and this is a mistake.
Trend lines - wrong way of drawing them
Trendlines : Correct Way
(multiple pictures)
Descending trend lines should be from the TOP. Not the bottom.
Ascending trend lines should be from the BOTTOM. Not the top.
Ascending trend lines should be drawn from the bottom.
Descending trend lines should be drawn from the top.
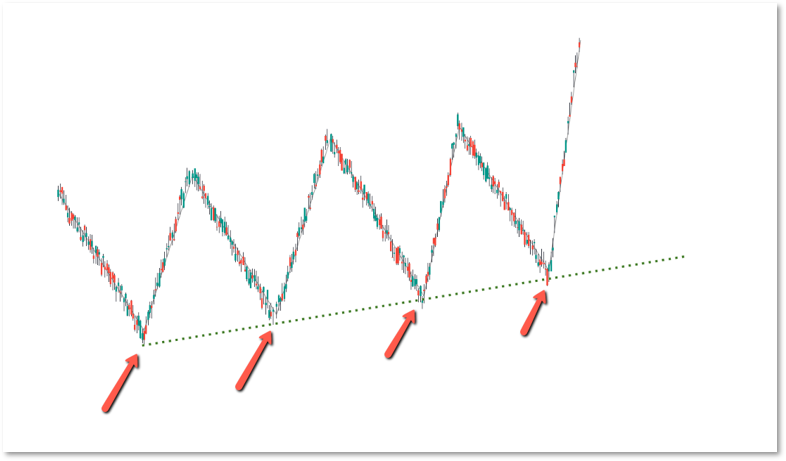
Trendlines : 3 Significant Touches
(multiple pictures)
Trend lines should at least have 3 significant touches.
2 touches tend to be more coincidental which is why we go for at least 3 touches.
Trend line rules - You should watch out for at least 3 significant touches for it to be considered a valid trend line.
Trend lines - playing the reaction off the 4th touch.
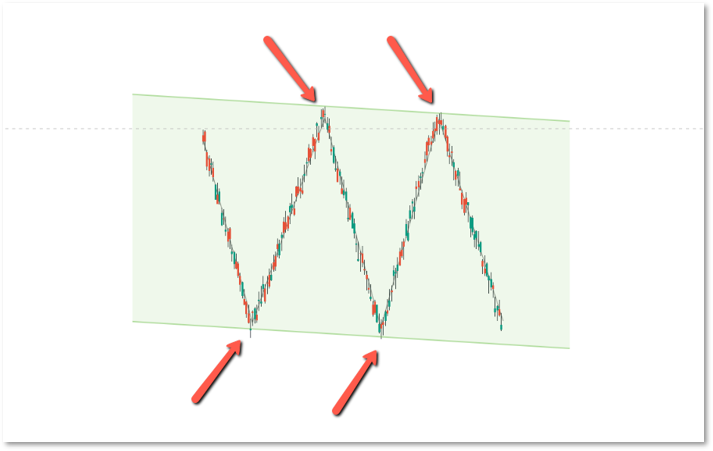
Channels: 4 Significant Touches
Channels require at least 4 significant touches. 2 at the top, 2 at the bottom, for it to be considered a valid channel.
They do not need to be in consecutive order like the picture on the right.
Channels - at least 4 significant touches are needed for it to be considered a valid channel.
We use cookies on our website to give you the most relevant experience by remembering your preferences and repeat visits. By clicking “Accept”, you consent to the use of ALL the cookies.
This website uses cookies to improve your experience while you navigate through the website. Out of these cookies, the cookies that are categorized as necessary are stored on your browser as they are essential for the working of basic functionalities of the website. We also use third-party cookies that help us analyze and understand how you use this website. These cookies will be stored in your browser only with your consent. You also have the option to opt-out of these cookies. But opting out of some of these cookies may have an effect on your browsing experience.
Necessary cookies are absolutely essential for the website to function properly. This category only includes cookies that ensures basic functionalities and security features of the website. These cookies do not store any personal information.
Any cookies that may not be particularly necessary for the website to function and is used specifically to collect user personal data via analytics, ads, other embedded contents are termed as non-necessary cookies. It is mandatory to procure user consent prior to running these cookies on your website.